All work

Exo-View

Live 3D solar system & world data

The solar system, live - every planet and moon where it really is right now - and an Earth you can read: 217 countries coloured by 28 World Bank indicators, and a ranking you weight yourself.

Open exo-view.com
Role
Product · Design · Engineering
Type
WebGL · Data visualisation
Stack
three.js · globe.gl · d3-geo · Vite
Data
World Bank Open Data · SIPRI
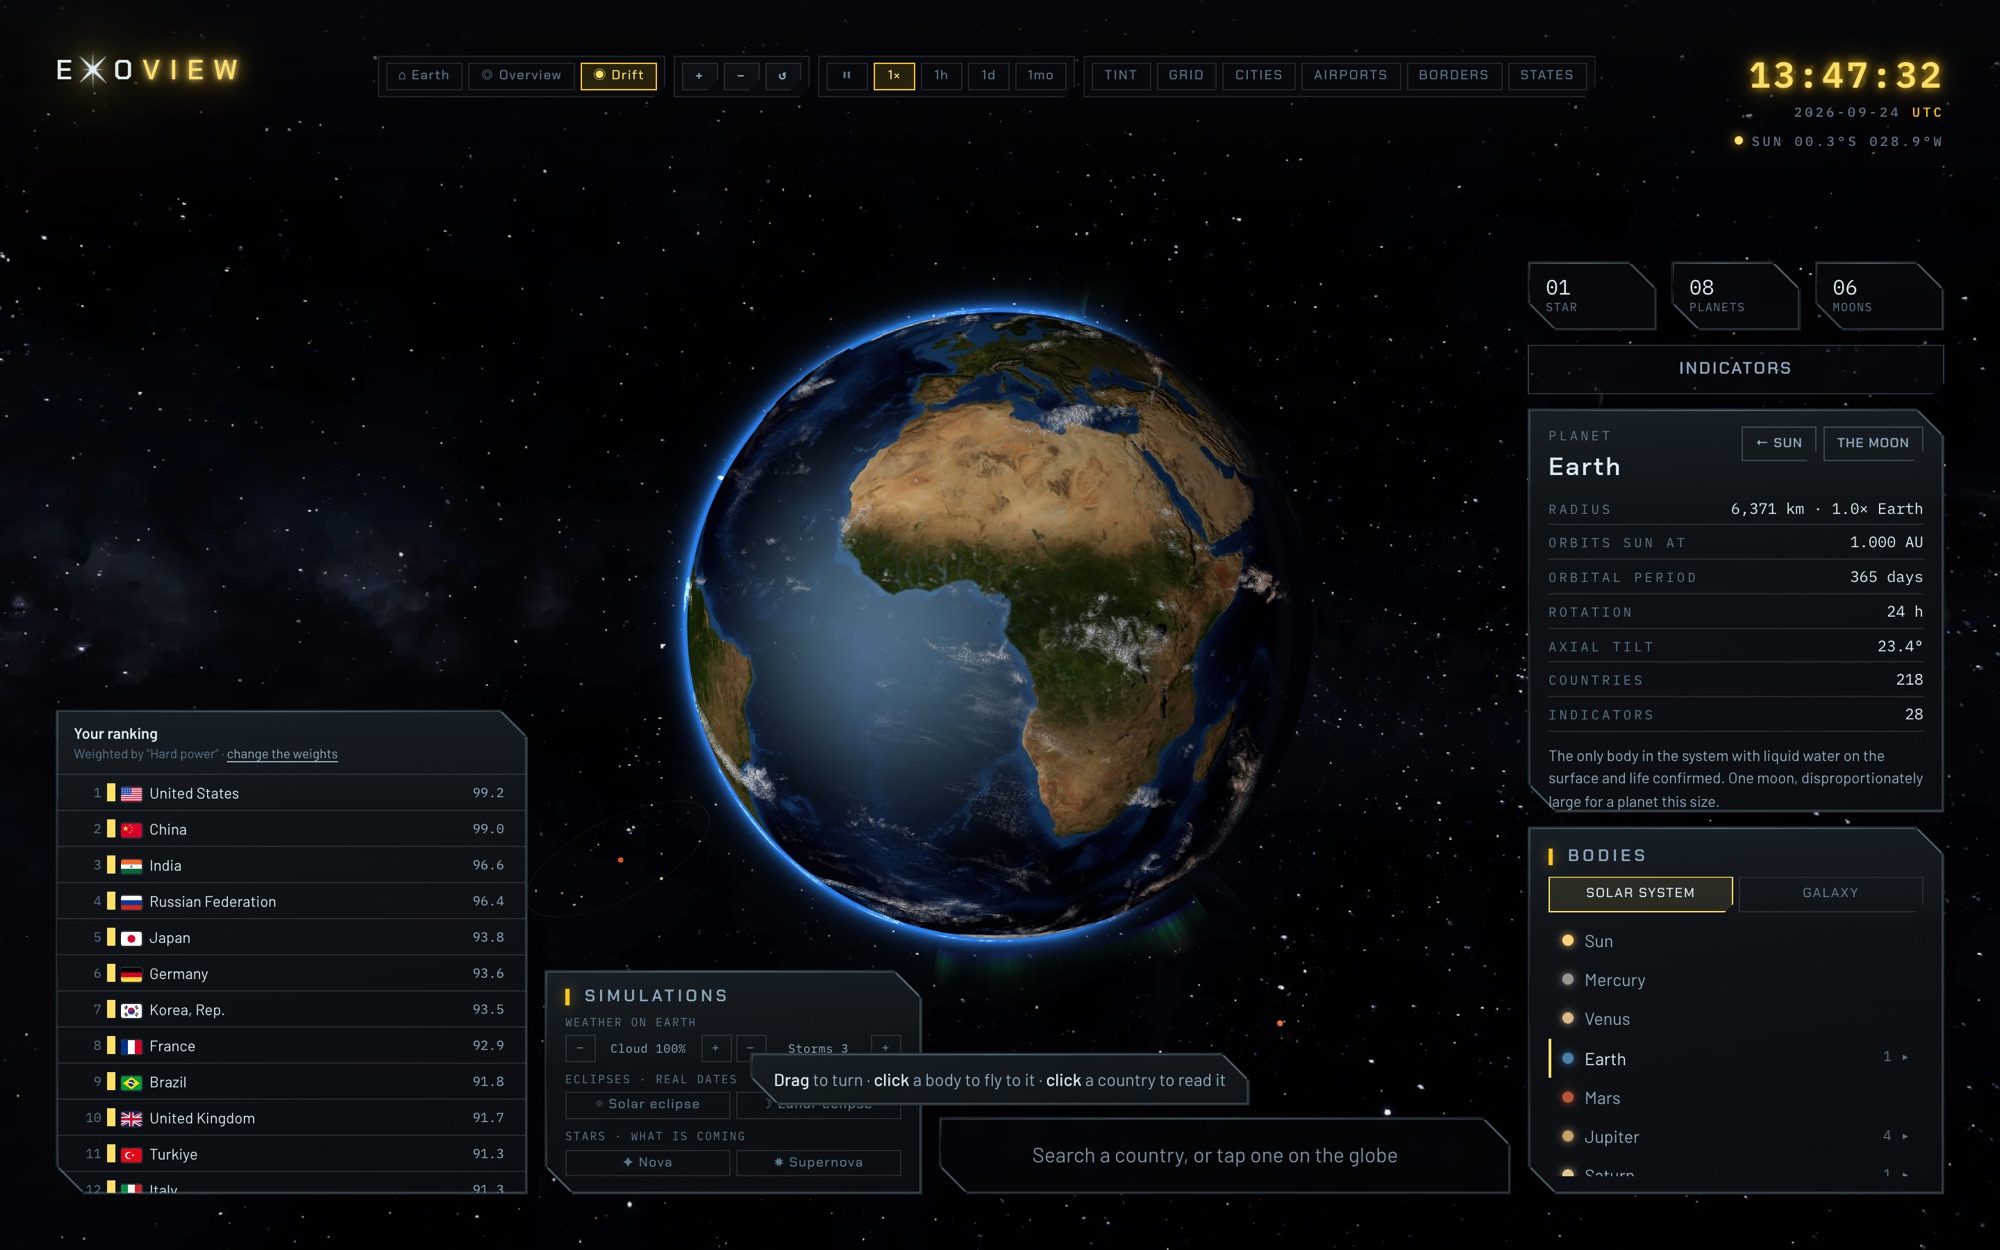
Exo-View - the Earth as the interface, with ranking, bodies and simulations panels

What it is

Country-ranking sites are everywhere, and they all look like a spreadsheet with a map glued to the side. Exo-View starts from the other end: a real planet is the entire interface. The globe fills the window, every panel floats over it, and the camera goes from a country's borders out past Neptune without a mode switch.

Two things sit on top of that planet. A weighted index you build yourself - so the question is “what makes a country matter to you”, not the site's own score - and a real sky: true relative orbital spacing, real radii and tilt, a live day/night terminator, and the actual positions of the planets for this instant.

What it refuses to do

  • Fake real-time - No spinning counters. Every figure is an annual estimate, shown with its own year
  • Hide the scale trick - Distances and radii use separate scales, and the page says so
  • Score what isn't there - A missing figure drops out of the average instead of counting as zero
  • Ask for an account - Nothing to sign up for. The whole state lives in the link

What you can do

  • Read a country - Click it, get every indicator with its rank and year
  • Recolour the planet - Pick any of 28 indicators and the tint follows
  • Build an index - Weight what matters, flip “less is better”, share the link
  • Leave Earth - Fly to any planet or moon, or run an eclipse, a nova, a supernova

How it's built

Scene
three.js
Blue Marble terrain, clouds, aurora
shared with Exo-Race
Sky
Ephemeris
Real orbital elements
positions for the current instant
Data
ETL script
World Bank + SIPRI to JSON
committed, so a clone just runs
State
URL hash
Any ranking is a link
that reproduces it exactly
217countries with a full profile
28indicators in six categories
8 + 6planets and moons, live
0accounts - state lives in the link

The screens

A country, read

Click a country or search for it and the camera flies in. The zoom is derived from the country's angular size and the camera's field of view, so Monaco ends up closer than Russia instead of both getting the same multiplier. The profile lists every indicator with its rank out of how many reported it, and the year it belongs to.
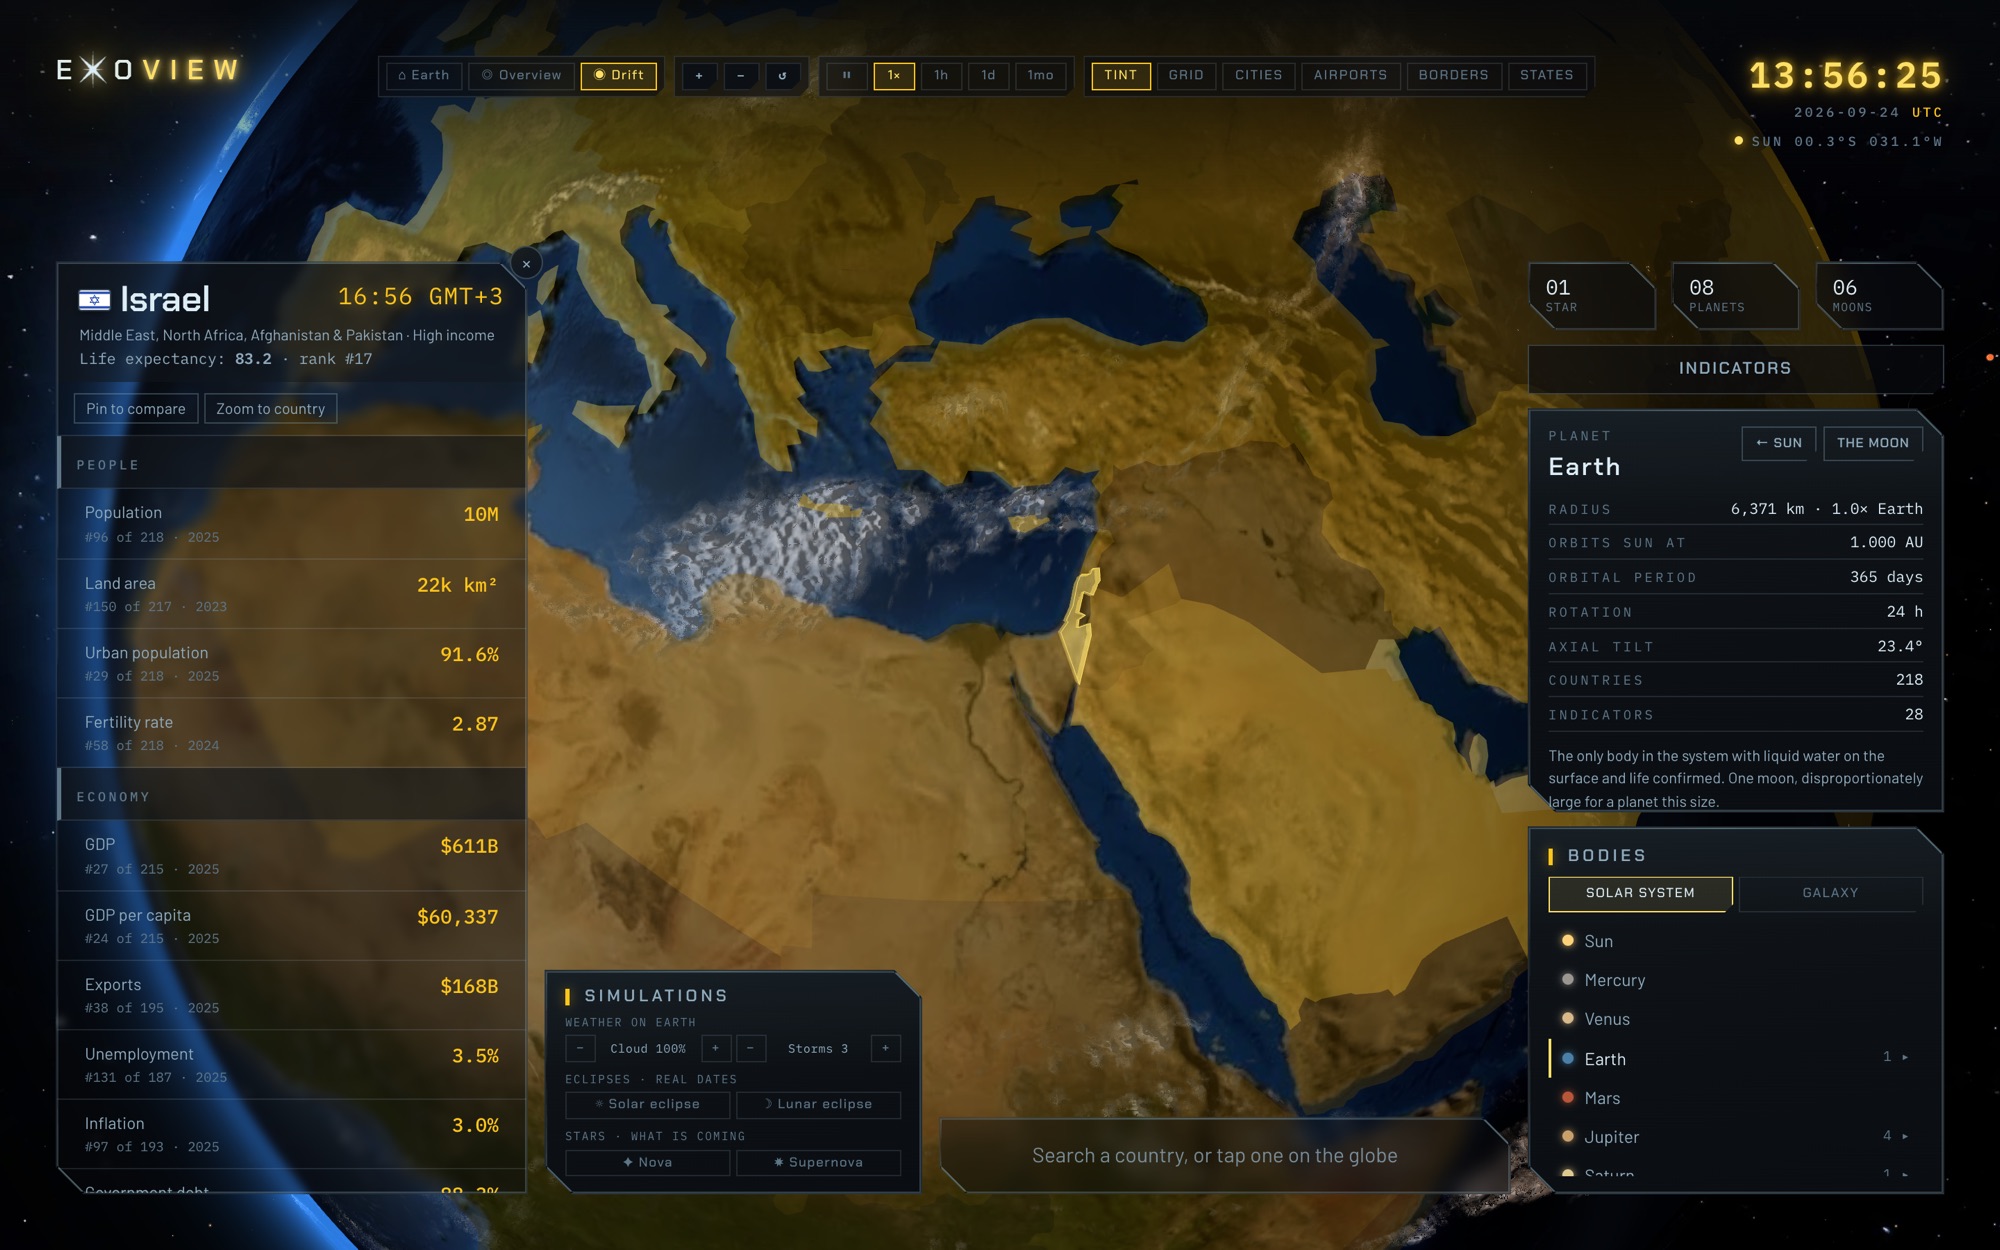
Exo-View - Israel's profile over the tinted globe

The index builder

The feature the product exists for. Each slider shows its share of the total weight, not its raw position - one slider at 20 with the rest at zero is 100% of the index, and used to claim 20%. Four presets mean nobody opens the builder to a wall of zeros, and the floating panel says “Your ranking”, because it is an opinion, not the site's verdict.
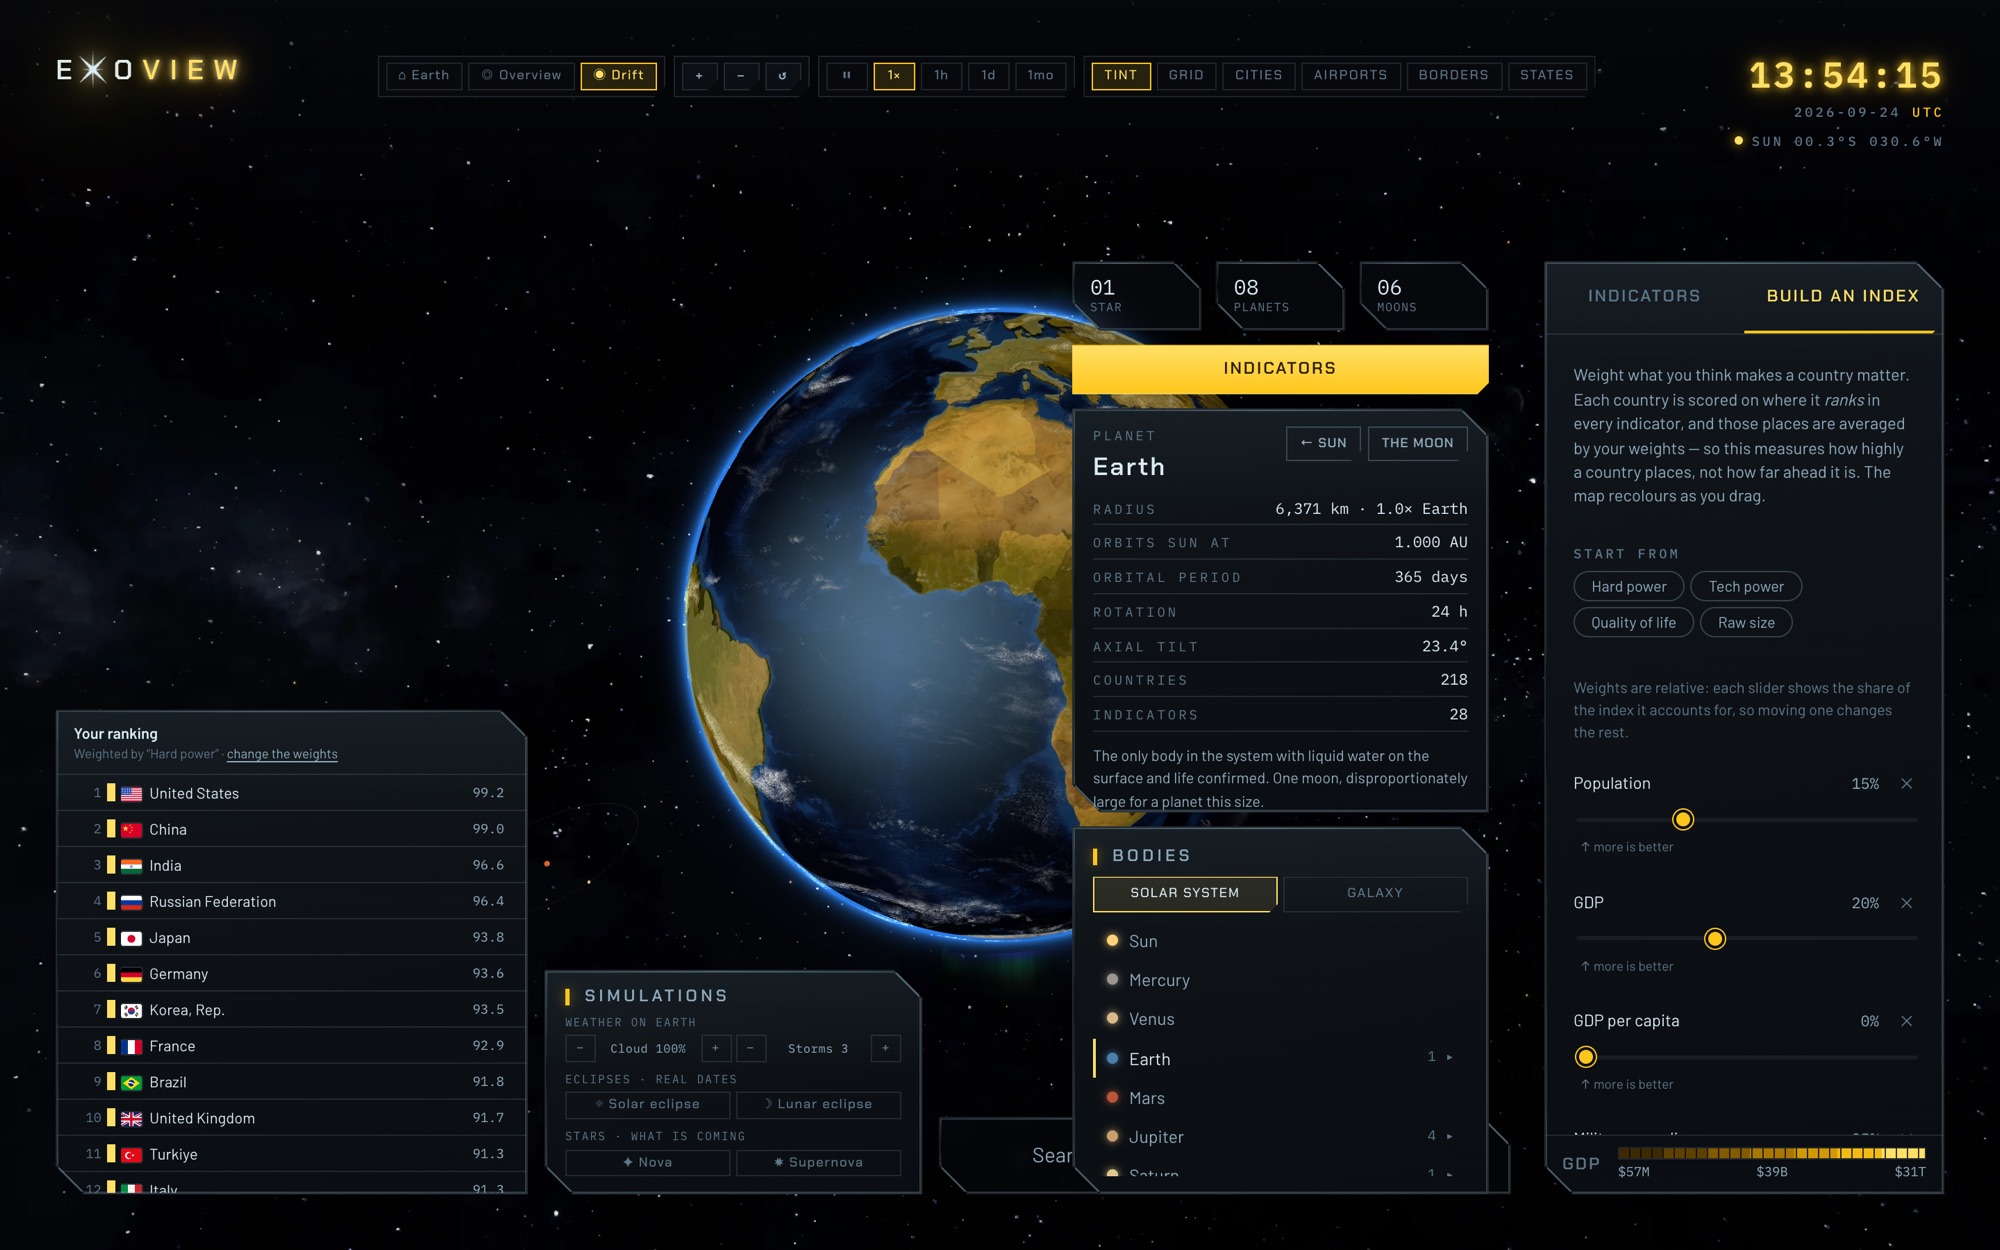
Exo-View - building a weighted index
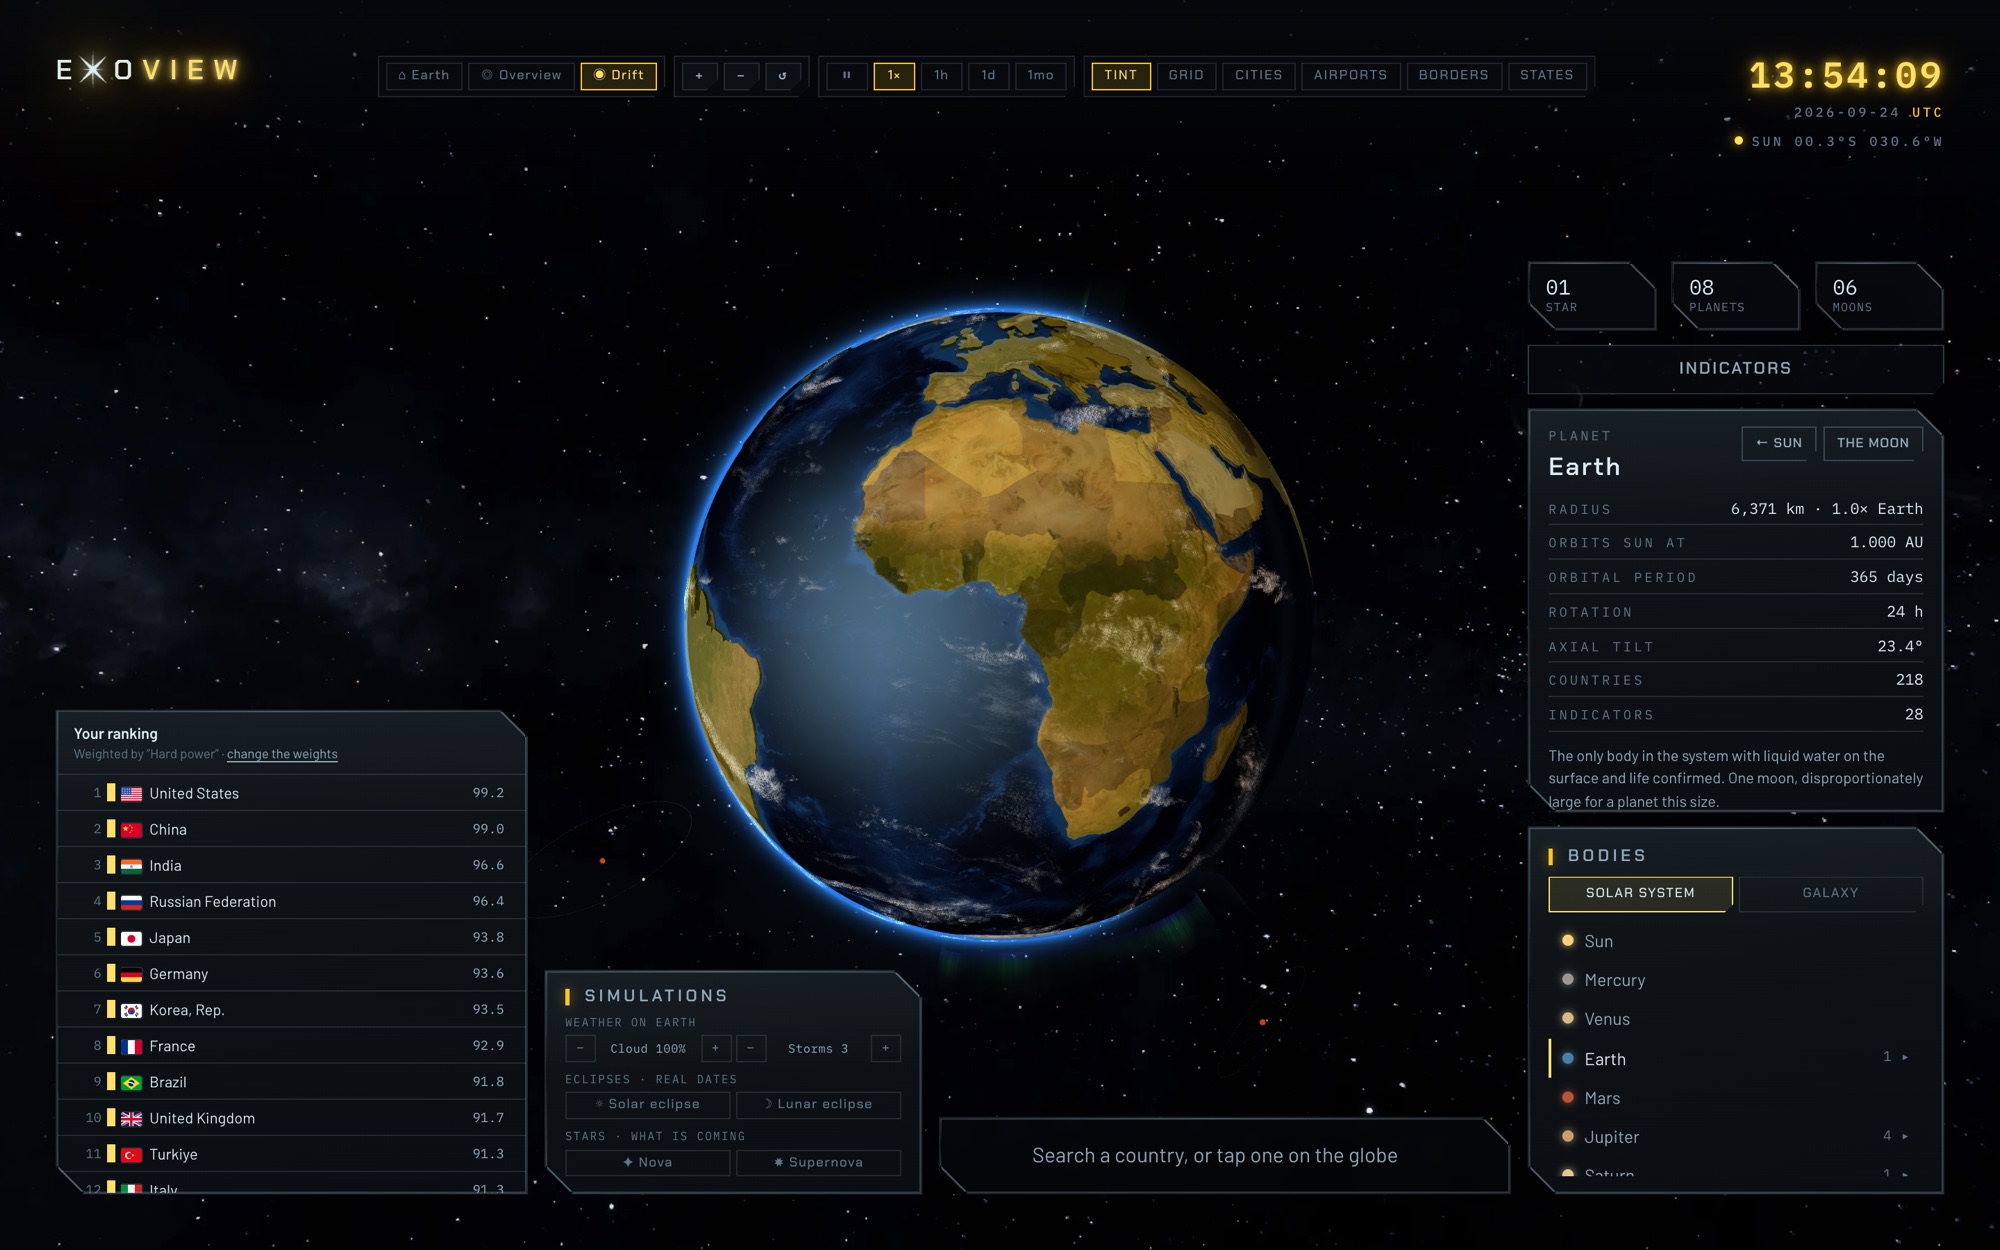
Exo-View - the globe tinted by GDP

The rest of the system

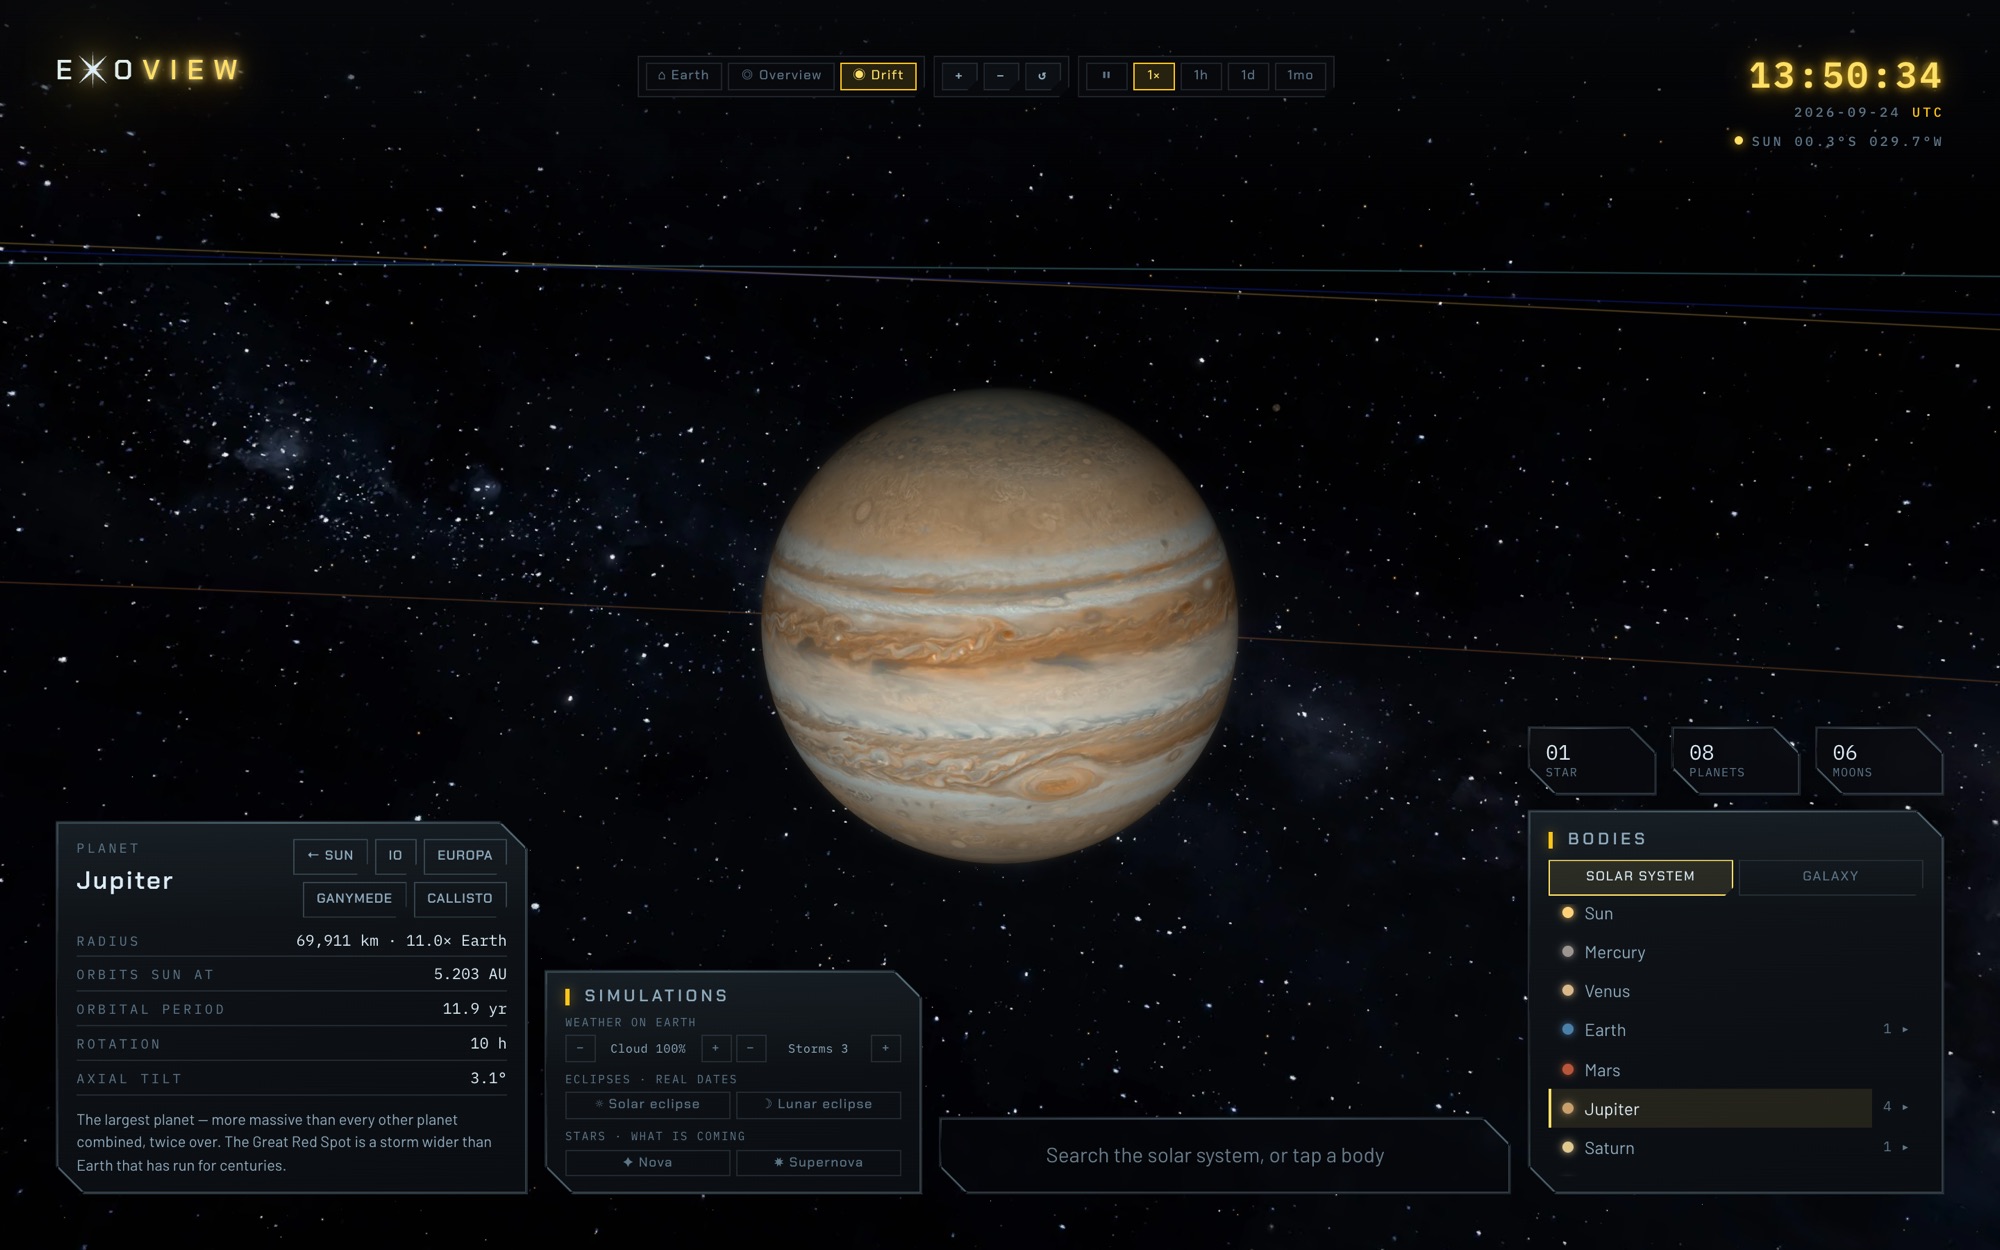
Earth is one body in a list like any other - there is no “back” button, because picking Earth is the way home. Each body's card carries real radius and its ratio to Earth, orbit, period, rotation and tilt.
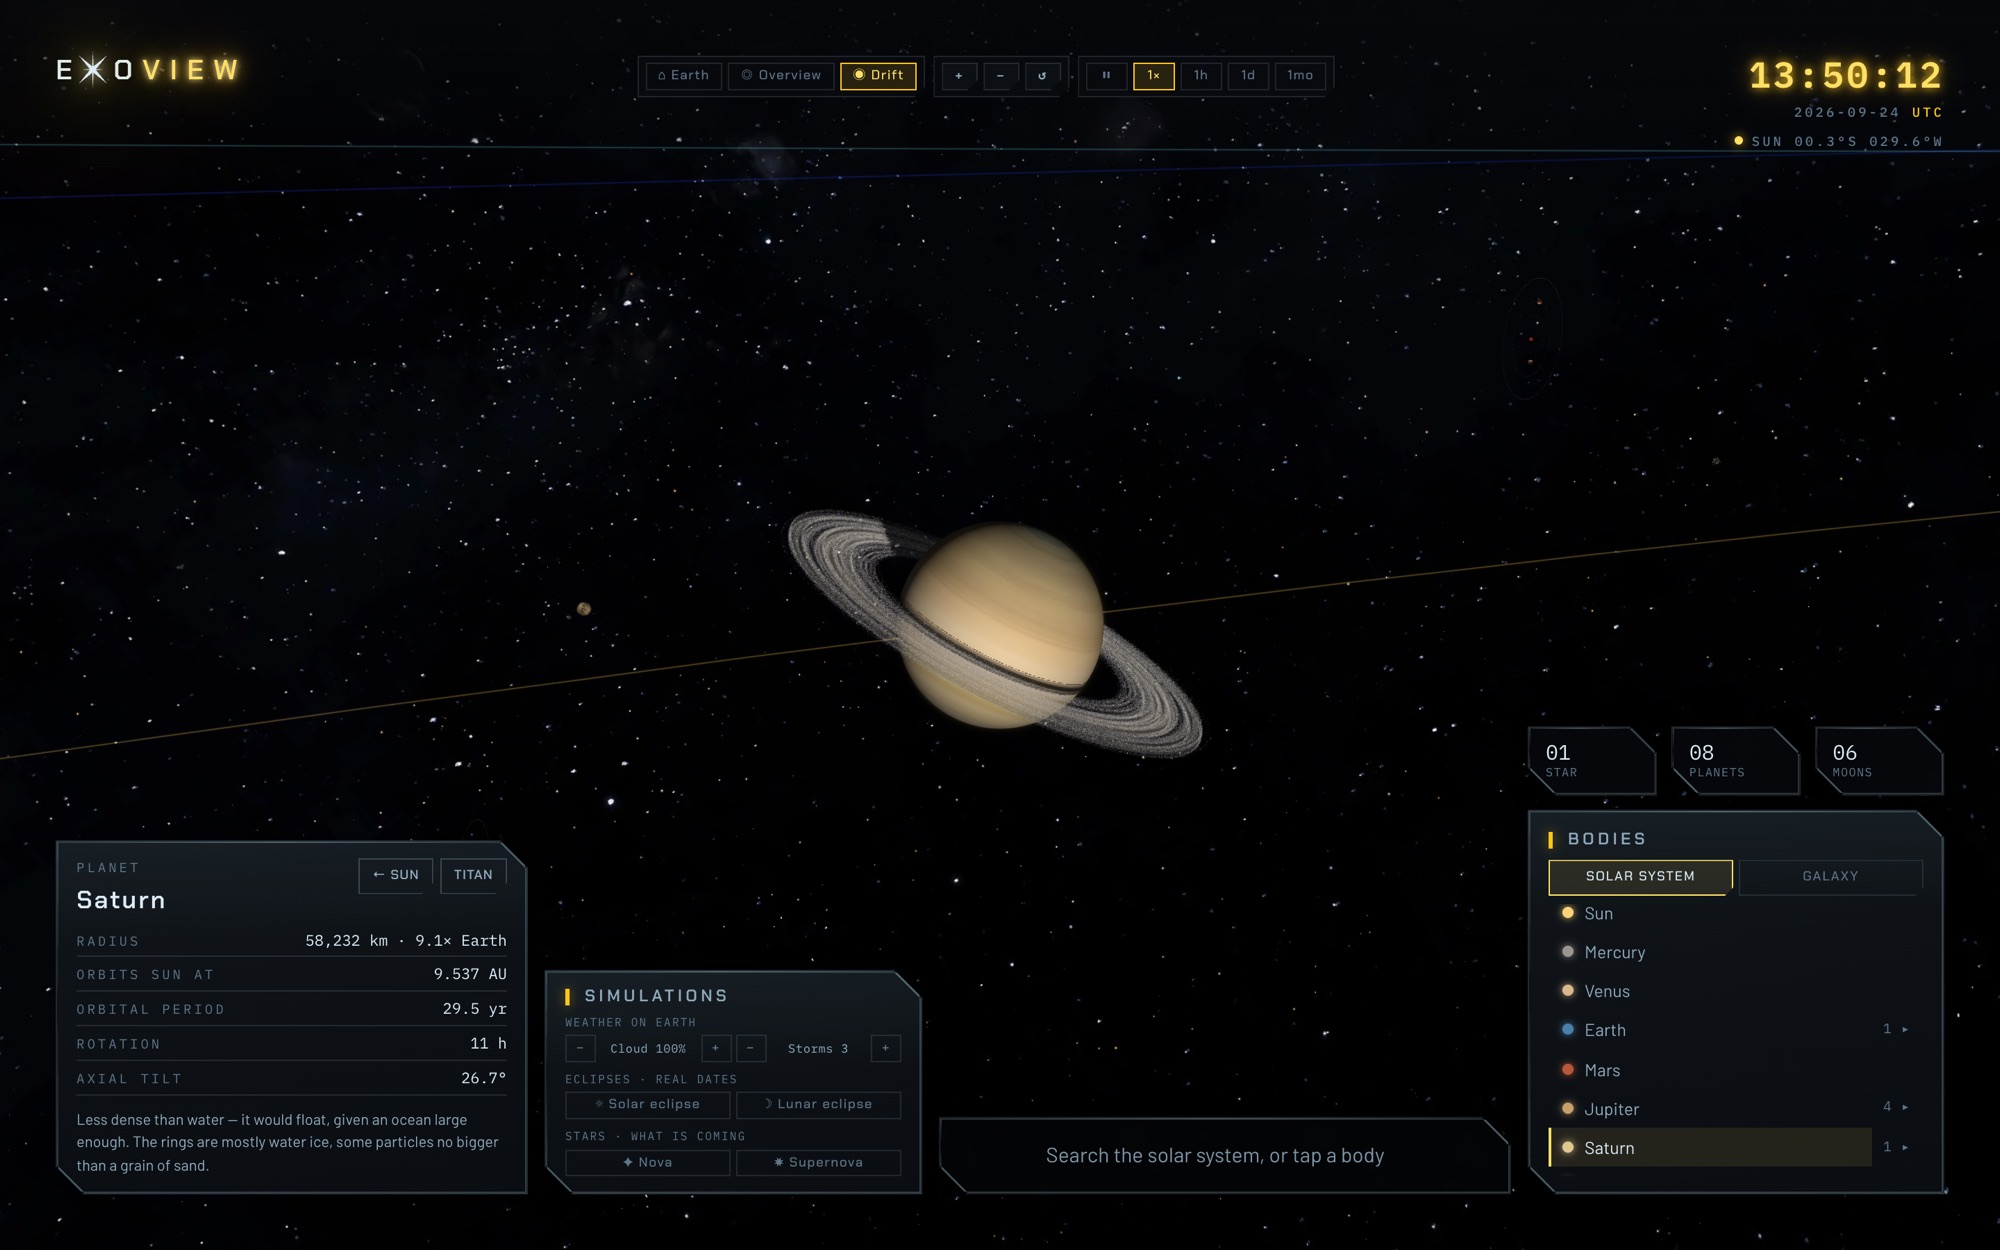
Exo-View - Saturn
Exo-View - Jupiter

First paint, then the planet

The landing is the product, not a picture of it: the same live Earth, already turning. The globe is its own bundle chunk, fetched after first paint, so the panels, rankings and builder are usable before three.js has finished downloading.
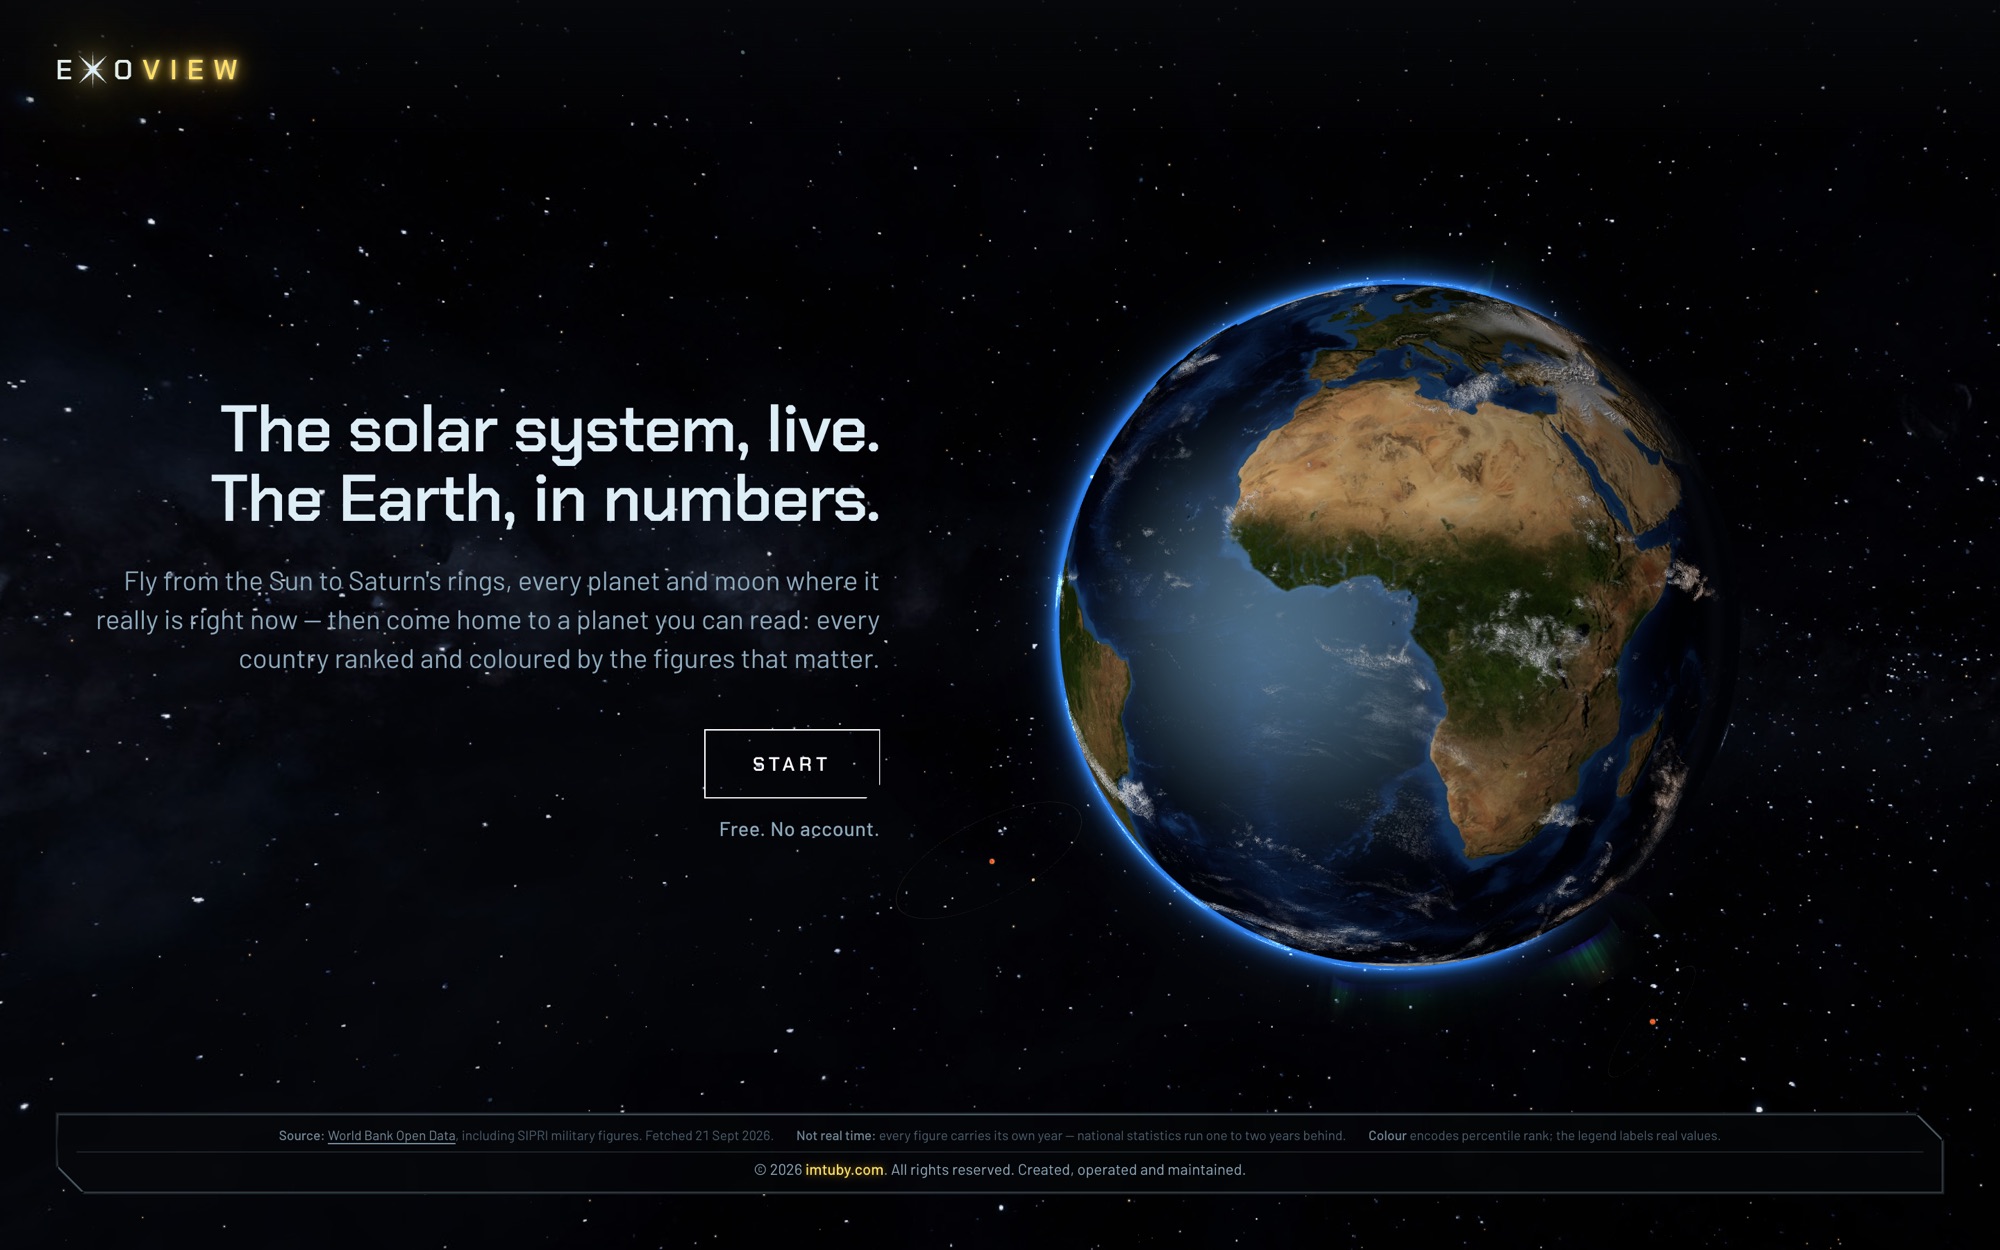
Exo-View - landing

On a phone

The instrument deck folds into a drawer and the planet keeps the whole screen. Search stays pinned at the bottom, under the thumb.
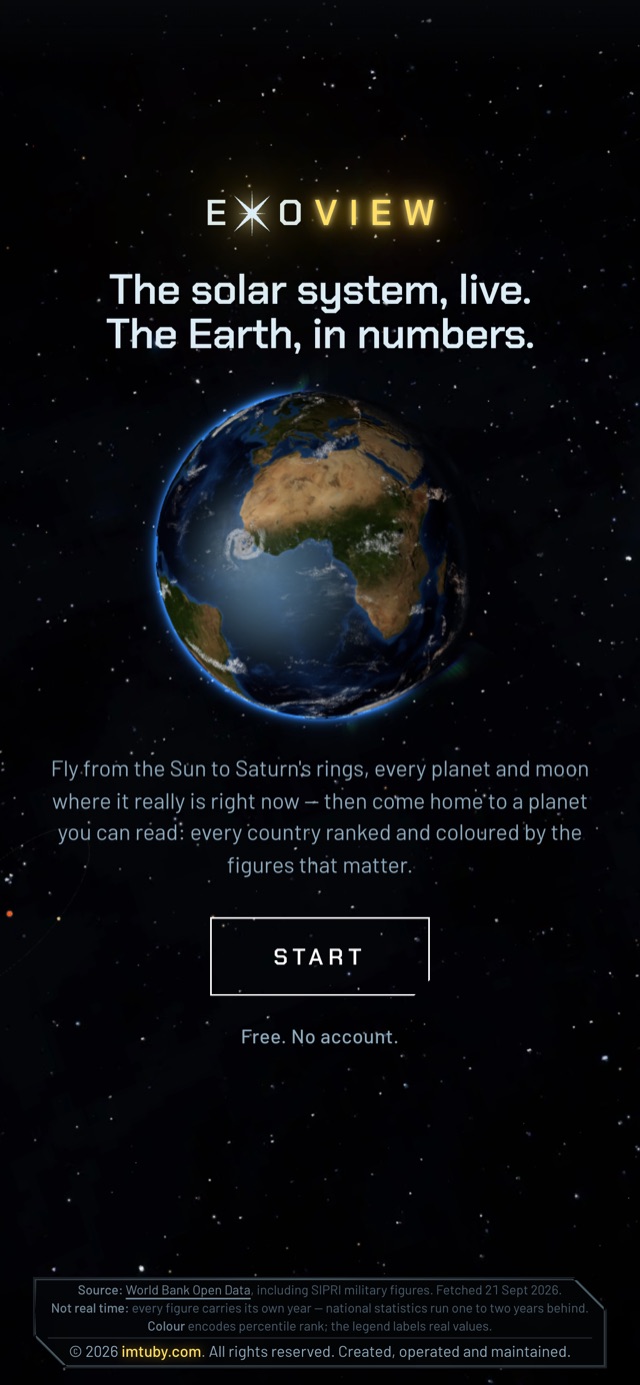
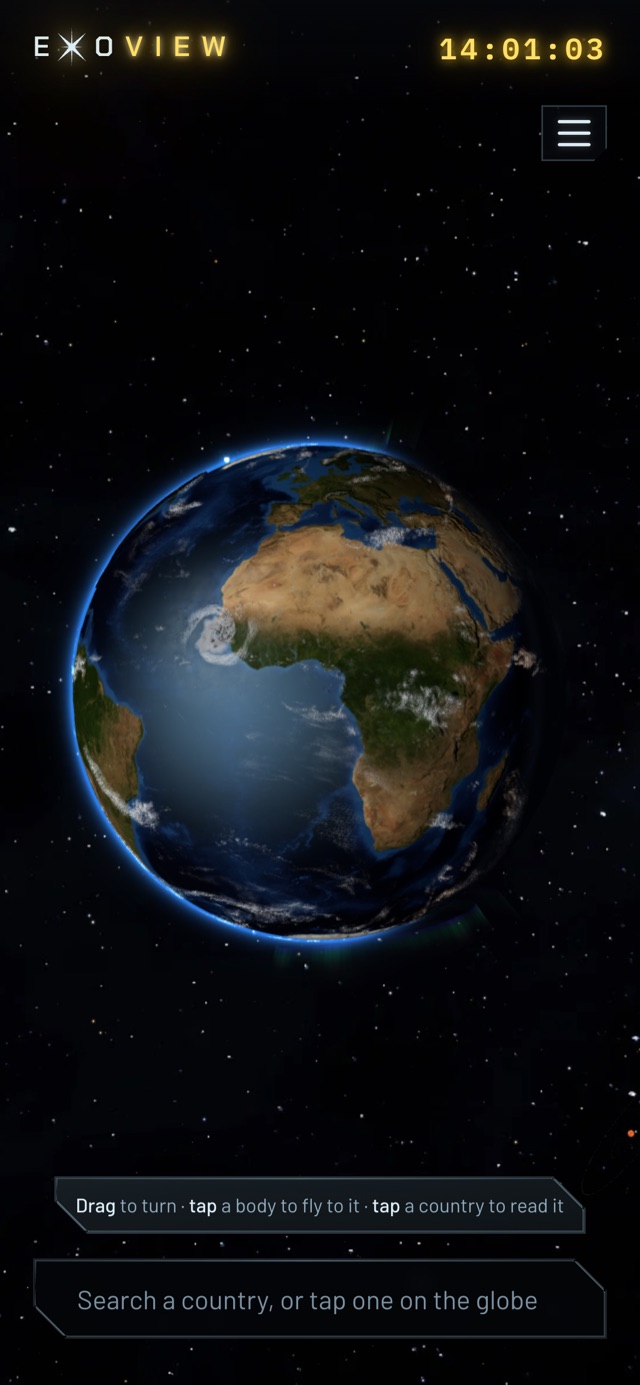
Exo-View on mobile - landing
Exo-View on mobile - the globe

Design decisions

01

  • Percentile, not raw value - A linear scale on GDP gives one dark country and two hundred identical pale ones. Colour encodes rank; the legend still labels real values.

02

  • Data over the planet, not instead of it - The tint is laid on at a third opacity, so coastlines, relief and city lights still read through the numbers.

03

  • Thin data stays off the podium - A country is left unscored if more than half the assigned weight can't be answered for it.

04

  • Links that survive growth - The index is stored as named key:weight pairs, not positions, so adding an indicator tomorrow can't break a link shared today.

05

  • No honest direction, no slider - Land area, fertility, urbanisation and inflation can be browsed but not weighted: none has a single “more is better”.

06

  • An instrument, not a dashboard - A mono readout, a clock in UTC and chamfered panels: the chrome reads like equipment pointed at the sky.
Next project
Strata →
Get in touch